

When developing new features, or when changing some settings, one must always ask, does the site perform slower or faster than before?
Although to answer this question correctly maybe it is better to consult an expert, especially if we are talking about a live site. I want to talk about an easy way to see how a webserver performs when changes occur. You do not have to be too familar with concepts like performance testing, load, and so on. Using a real example maybe is more understandable.
This year in the GSoC program, there is a project about SQL optimization, so for this example we are going to test how an SQL optimization Pull Request affects the performance of a webserver: faster I hope.
The most important thing is to be sure that we are comparing "apples to apples", so some settings to the environment are requested and therefore run this procedure on your localhost. We are going to use a couple of simple tools, because they are very easy to use are widely available on all systems and are free. There are a lot of other and more powerful tools that can be used instead, but I'm too lazy to learn the others.
The tools:
- Apache Bench (ab) is a tool for benchmarking HTTP
- mysqlslap is a diagnostic program designed to emulate client load for a MySQL server
Requirements:
- webserver - I use xampp on windows
- ab – Apache Benchmark
- myslslap – to test SQL
- gnuplot - to show results as a graph or a spreadsheet
Prepare the environment:
- install a fresh joomla site and load it with tons of data, and name it nogsoc
- or Restore a Joomla site from a backup and name it nogsoc
- clone nogsoc site into a new one , and name it gsoc
Environment settings
Mysql
Disable the query cache on mysql. You can disable the query cache by setting:
SET GLOBAL query_cache_size = 0;
Joomla settings
- Disable Joomla cache
- Enable debug plugin
- On the gsoc site install the com_patchtester to manage PR's, and apply the PR you want to test
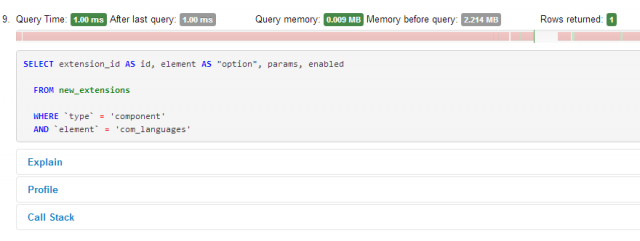
The Debug plugin
With the debug plugin enabled you already have a snapshot of what occurs to your site when serving your request. Looking at the tab Database queries, for example, there is a log of all queries that have been executed while loading the page with the time taken to execute the query and some other usefull info.
Let's start testing
The debug plugin told us something when a request is served. now we want to know how it performs when many requests are served. It is time to run the first session of the benchmark test.
Running ab
ab -n 500 -c 100 -g out.data http://localhost/
issuing this command on your terminal you are asking to stress:
- the url localhost
- with 100 concurrent request (-c)
- for 500 times (-n)
- save data for gnuplot (-g)
Running ab against yourself (localhost), eliminates network issues from the performance results.
Analyse ab result
With the above command we have asked ab to tell us: How does it perform when 100 concurrent requests reached the webserver? The ab answer is rich in information. The ab output is something like this:
Concurrency Level:      100
Time taken for tests:   159.182 seconds
Complete requests:      500
Total transferred:      33498213 bytes
HTML transferred:       33321313 bytes
Requests per second:    3.14 [#/sec] (mean)
Time per request:       31836.400 [ms] (mean)
Time per request:       318.364 [ms] (mean, across all concurrent requests)
Transfer rate:          205.51 [Kbytes/sec] received
Connection Times (ms)
              min  mean[+/-sd] median   max
Connect:        0    0   2.3      0      51
Processing:  5476 29602 5433.1  30703   35734
Waiting:     9461 30290 3585.0  30705   35734
Total:       5476 29603 5433.1  30703   35734
Percentage of the requests served within a certain time (ms)
  50%  30703
  66%  31342
  75%  31883
  80%  32535
  90%  33500  the 90% of all request was served under 33500 (ms)
  95%  34065
  98%  34700
  99%  35253
 100%  35734 (longest request)
The most important data to take into account from the ab result are:
Requests per second: it tells about the the overall performance impact. Higher is better. The above is 3,14 (req/sec)
Connection Times: I usually look at the row Waiting. The column median, 30705, tells us how long on average a page request took (in milliseconds). Lower is better. An indicator of how our test is good and is not affected by some lag, is the column standard deviation [+/- sd] , to consider a the test meaningful take in count test with a lower value of standard deviation.
Running Mysqlslap
The mysqlslap utility makes it possible to benchmark and compare MySQL performance, with a set of queries, in all of the available PR. In the Sql Optimization project there is information about what queries are affected by the PR, so it is quite simple to make two .sql files: one with the new queries and one with the old queries. So to see what happens simply issue this command from your terminal twice, one with the new, and one with the old:
mysqlslap --concurrency=100 --iterations=10 --query=pr9.sql --create-schema=test -uroot -padmin
we have asked mysqlslap how the following perform:
- the queries pr9.sql (--query)
- when 100 simultaneous connections (--concurrency)
- using the test datababse (--create-schema)
- run this test 10 times (--iteration)
Analyze mysqlslap results
Benchmark
	Average number of seconds to run all queries: 2.538 seconds
	Minimum number of seconds to run all queries: 2.108 seconds
	Maximum number of seconds to run all queries: 3.373 seconds
	Number of clients running queries: 100
	Average number of queries per client: 2
The mysqlslap result is very clear. It tells us that our queries ran in 2,538 seconds on average.
Test type
To better understand server behaviour, it is usefull to have two different kinds of tests for each benchmark tool running on both sites: the load test and stress test.
- the stress consists of running the same benckmark tool command several times
- the load consists of running different benchmark tool commands several times (what changes is the concurrent switch value it grows ie, 10,20,50,100,200)
Accurancy of results
In order to have a more accurate result or a good approx-estimation, take at least 10 readings or more, and use the best result (standard deviation lower). I recommend automating your test sessions with a shell script, and also consider scheduling them, as they can take a considerable amount of time to complete depending on your switch value or your webserver settings.
Plot your test data
It is quite difficult to examine a long series of cold numbers and understand what's going on, but when you look at this graph, it becomes much clearer what’s going on:
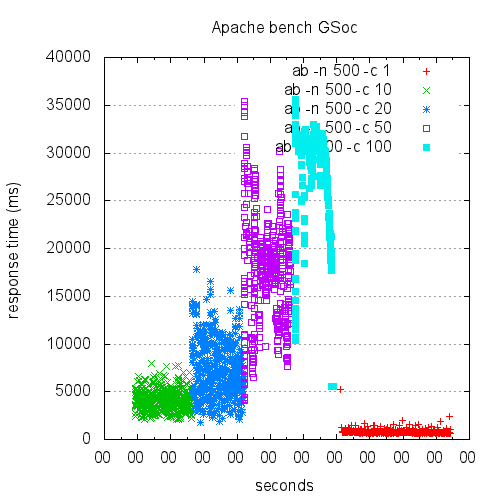
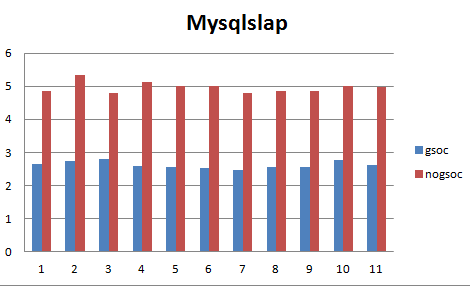
That kind of heatmap shows how the webserver performs when the concurrent request grows, data from ab (with the -g option). The one below compares how two different sets of queries perform, based on the average number of seconds to run all queries, showing y-axis seconds (lower is better), x-axis test number, for the mysqlslap data:
There are a lot more fancy and useful ways to show your data. Simply use your favorite tool like gnuplot or anything similar. When you are more confident in how your webserver performs, you can investigate different situations simply by changing the command tool parameters.
I wish you many good test sessions.
Comments