

Last month we looked at GA4 events and how GA4 collects data. This month we're going to look at how GA4 reports data, the standard reports and how we can customise those reports…
Standard GA4 Reports…
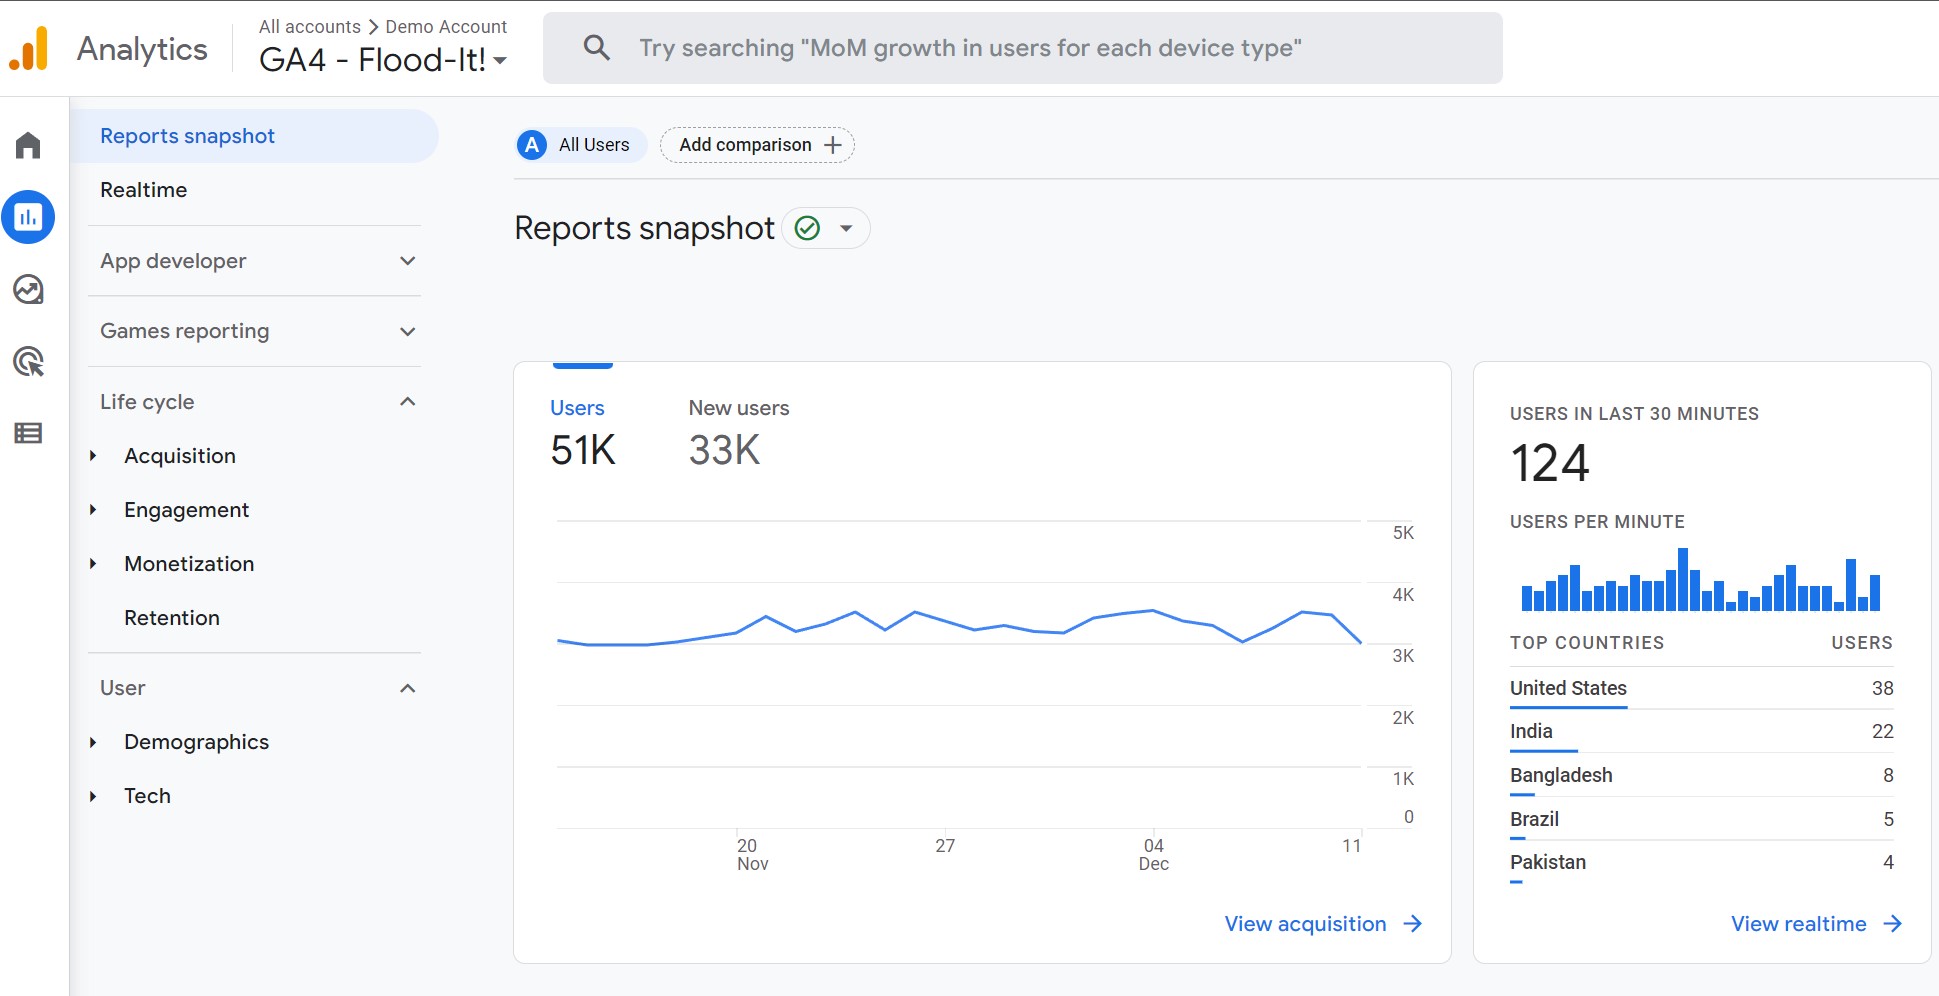
You can access the GA4 reports simply by clicking the Reports Icon on the left-hand side. This will display a menu of available reports, including a Reports snapshot, a Realtime report and many predefined reports.
Here is a quick summary of the types of available reports.
Overview Report
This type of report summarizes topic information such as acquisition overview and engagement overview.
Detail Report
As the name suggests, this report allows for more detail by enabling you to drill into one or two dimensions, such as purchases and events.
Predefined Reports
The predefined reports are divided into customisable report collections. There are four standard collections; you may only see some of them depending on the information provided in the setup. The image below is taken from the Google Demo account and shows all four collections detailed as follows:
App Developer
This summarizes app metrics from any connected mobile app.
Games Reporting
Provides game-specific info and customer behavior insights from your mobile gaming apps.
Life Cycle
This report collection helps us understand the customer journey and different acquisition and retention stages.
User
This report collection helps us to know our users better, such as their ages, interest, devices and app versions.
Report Filters
This is a brand new feature of GA4 as of August 2022 that allows you to tailor reports to your business. You can easily apply a filter to see a subset of your report data simply by clicking ‘add filter’ at the top of the detail report. Then, choose include or exclude from the filter builder on the right-hand side and select a dimension from the dropdown.
In this example, we will exclude a specific page from our report. Choose a report from the predefined report collections. I have chosen engagement / pages and screens from the Life Cycle collection.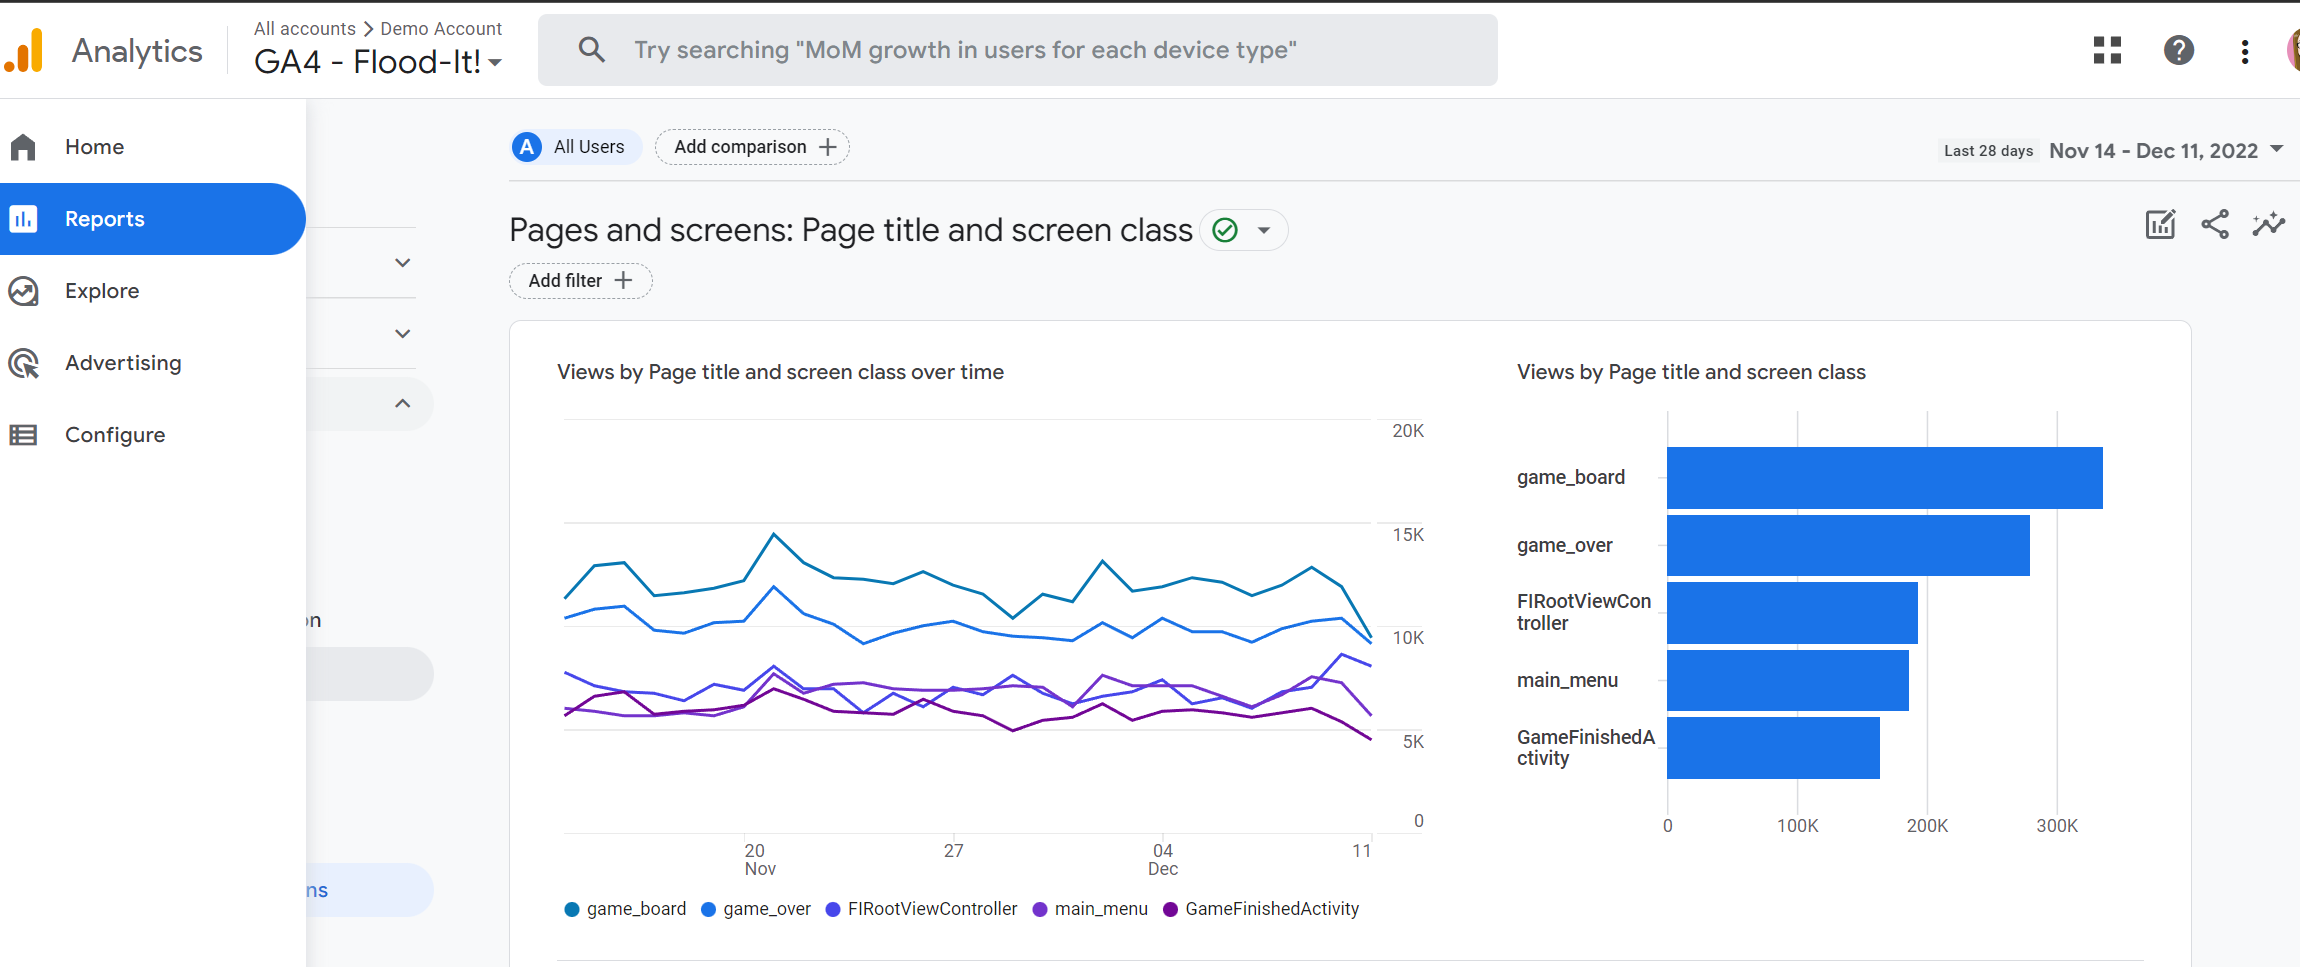
Click on the add filter button at the top of the screen; this brings up the filter builder on the right-hand side.
Then select exclude; this provides a dimension dropdown; here, I have selected 'Page path and screen class', which gives me a further Dimension dropdown.
Next, choose your dimension value; I have chosen/; this will now exclude all the homepage views from the report when I click apply.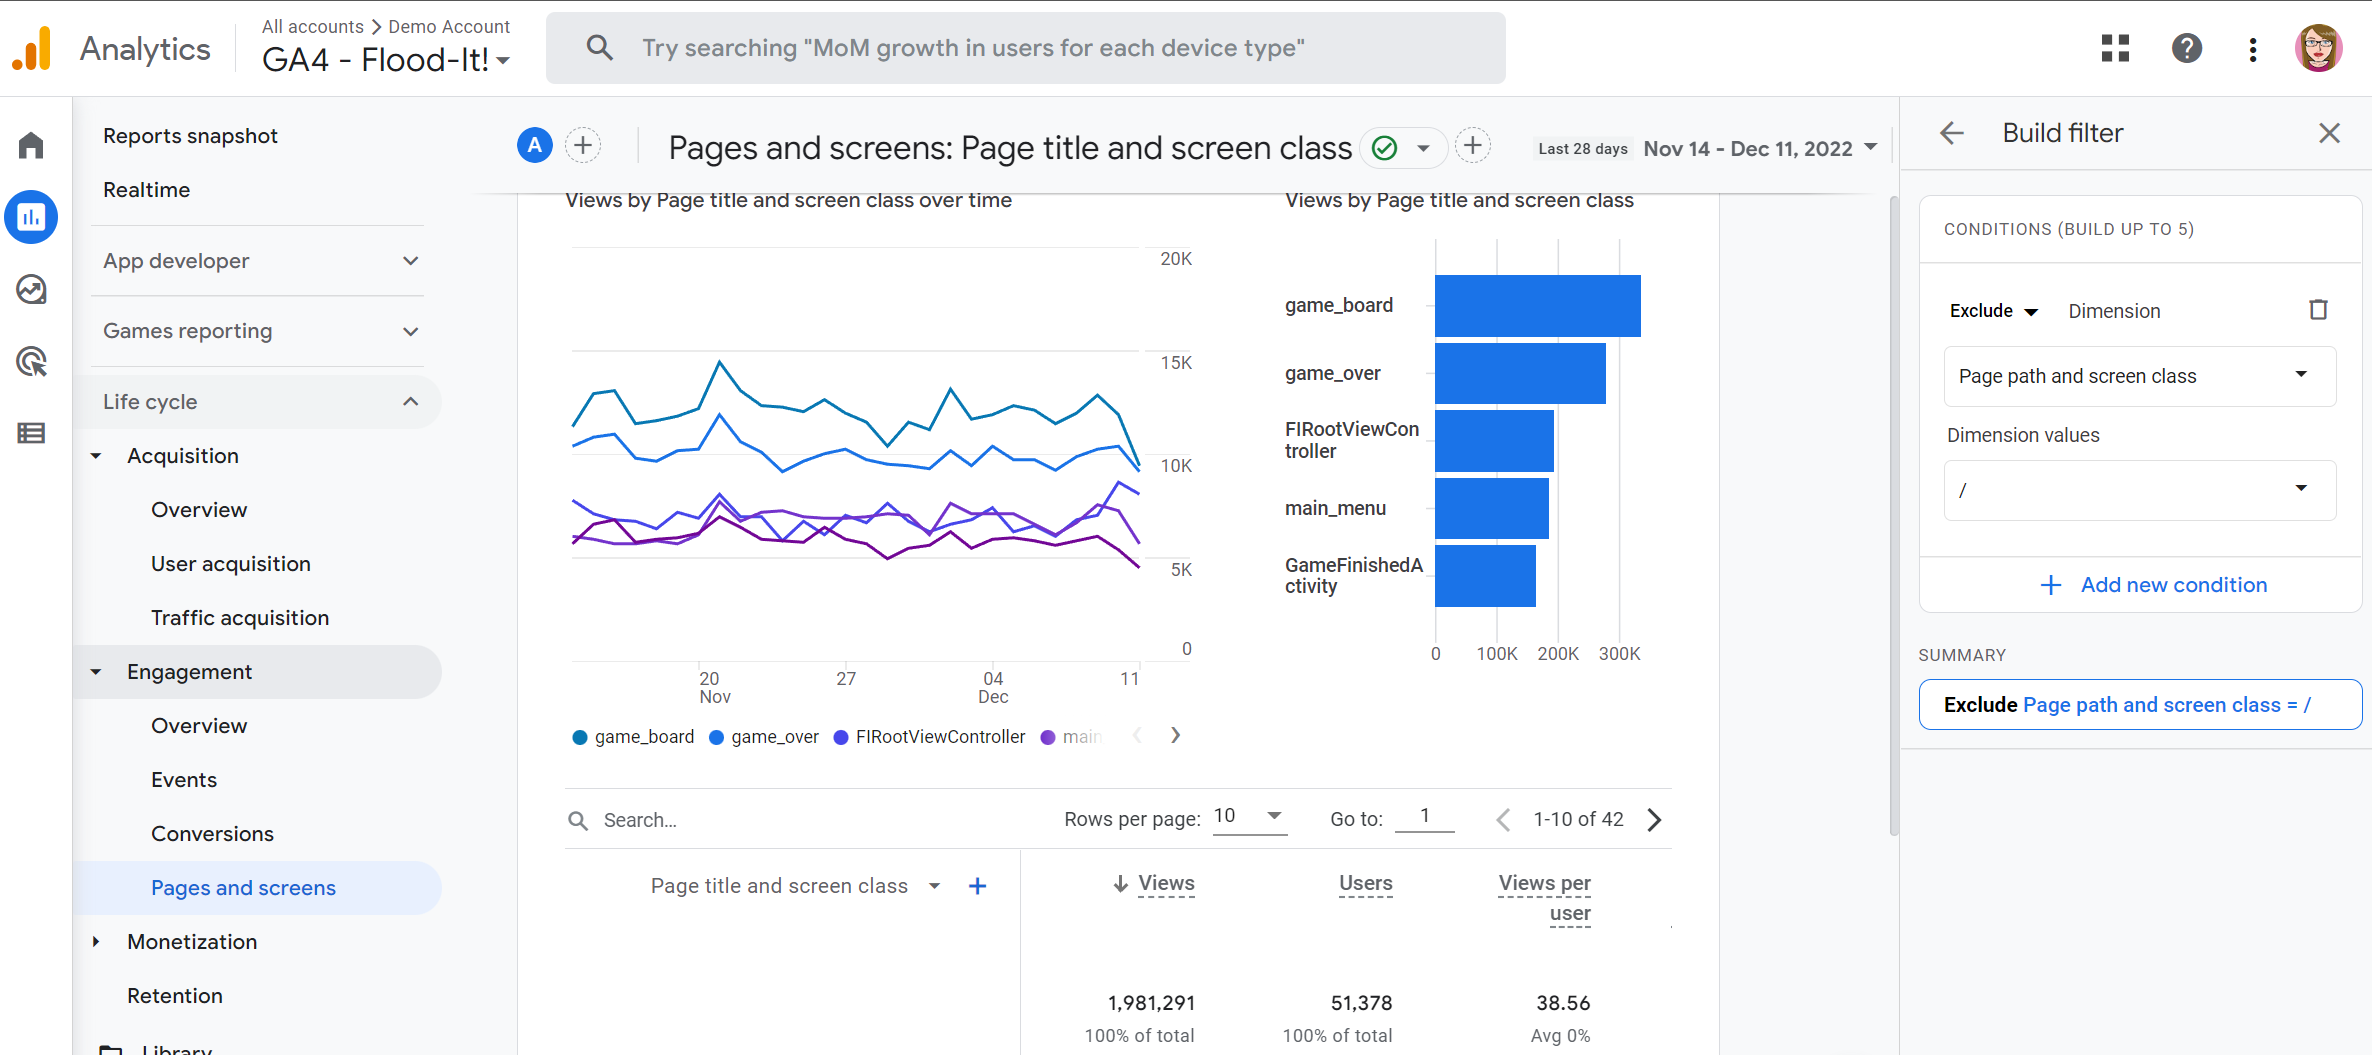
After applying the filters, the total number of views is reduced as the report excludes any homepage views.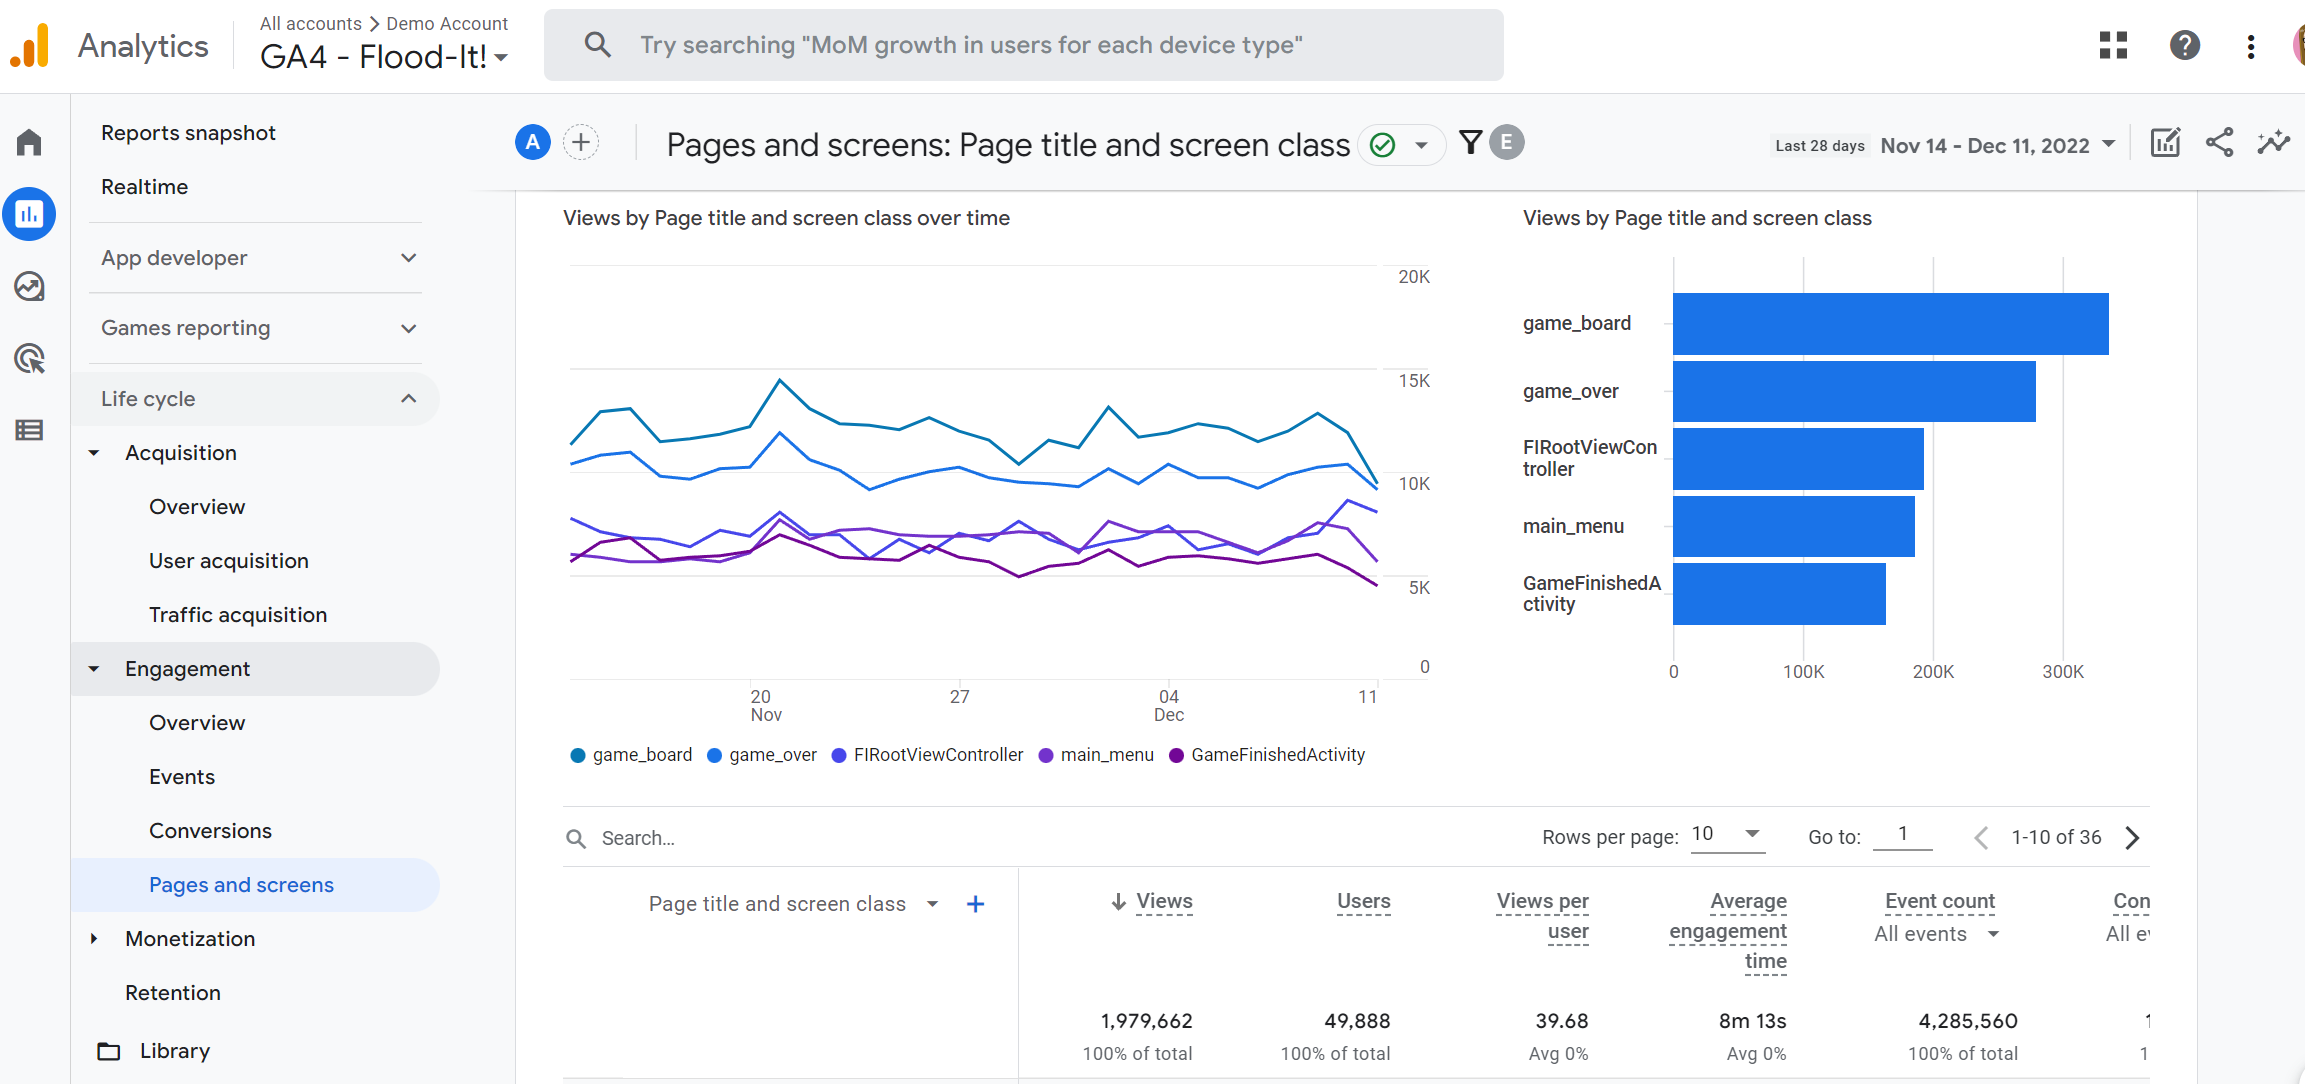
These filters can be saved to a custom detail report and a summary card. So, much like GA4 events, it's worth thinking about what reporting metrics are essential to your business or client's businesses and creating custom reports.
Report Comparisons
Conditions based on dimensions and dimension values can be compared; for example, if the Platform were the dimension, the values might be Android, iOS, or Web, or if the dimension was country, the dimension value could be Argentina, Japan, United Kingdom etc.
Multiple values for the same condition are evaluated with OR logic, whereas multiple conditions within the same comparison are evaluated with AND logic.
Let's try it out. Select any detail report from the predefined collections; for this example, I have selected the engagement report. Here we’re going to add some comparisons to establish the level of engagement from any given group of users, such as session medium including CPC, organic or referral.
Click on the Add comparison button. In the same way we added filters, select exclude or include and then your dimensions and dimension values.
Each comparison can have up to five conditions, and you can build up to four comparisons. Once all the comparisons and conditions have been applied, you can easily see which session medium contributed the most engagement.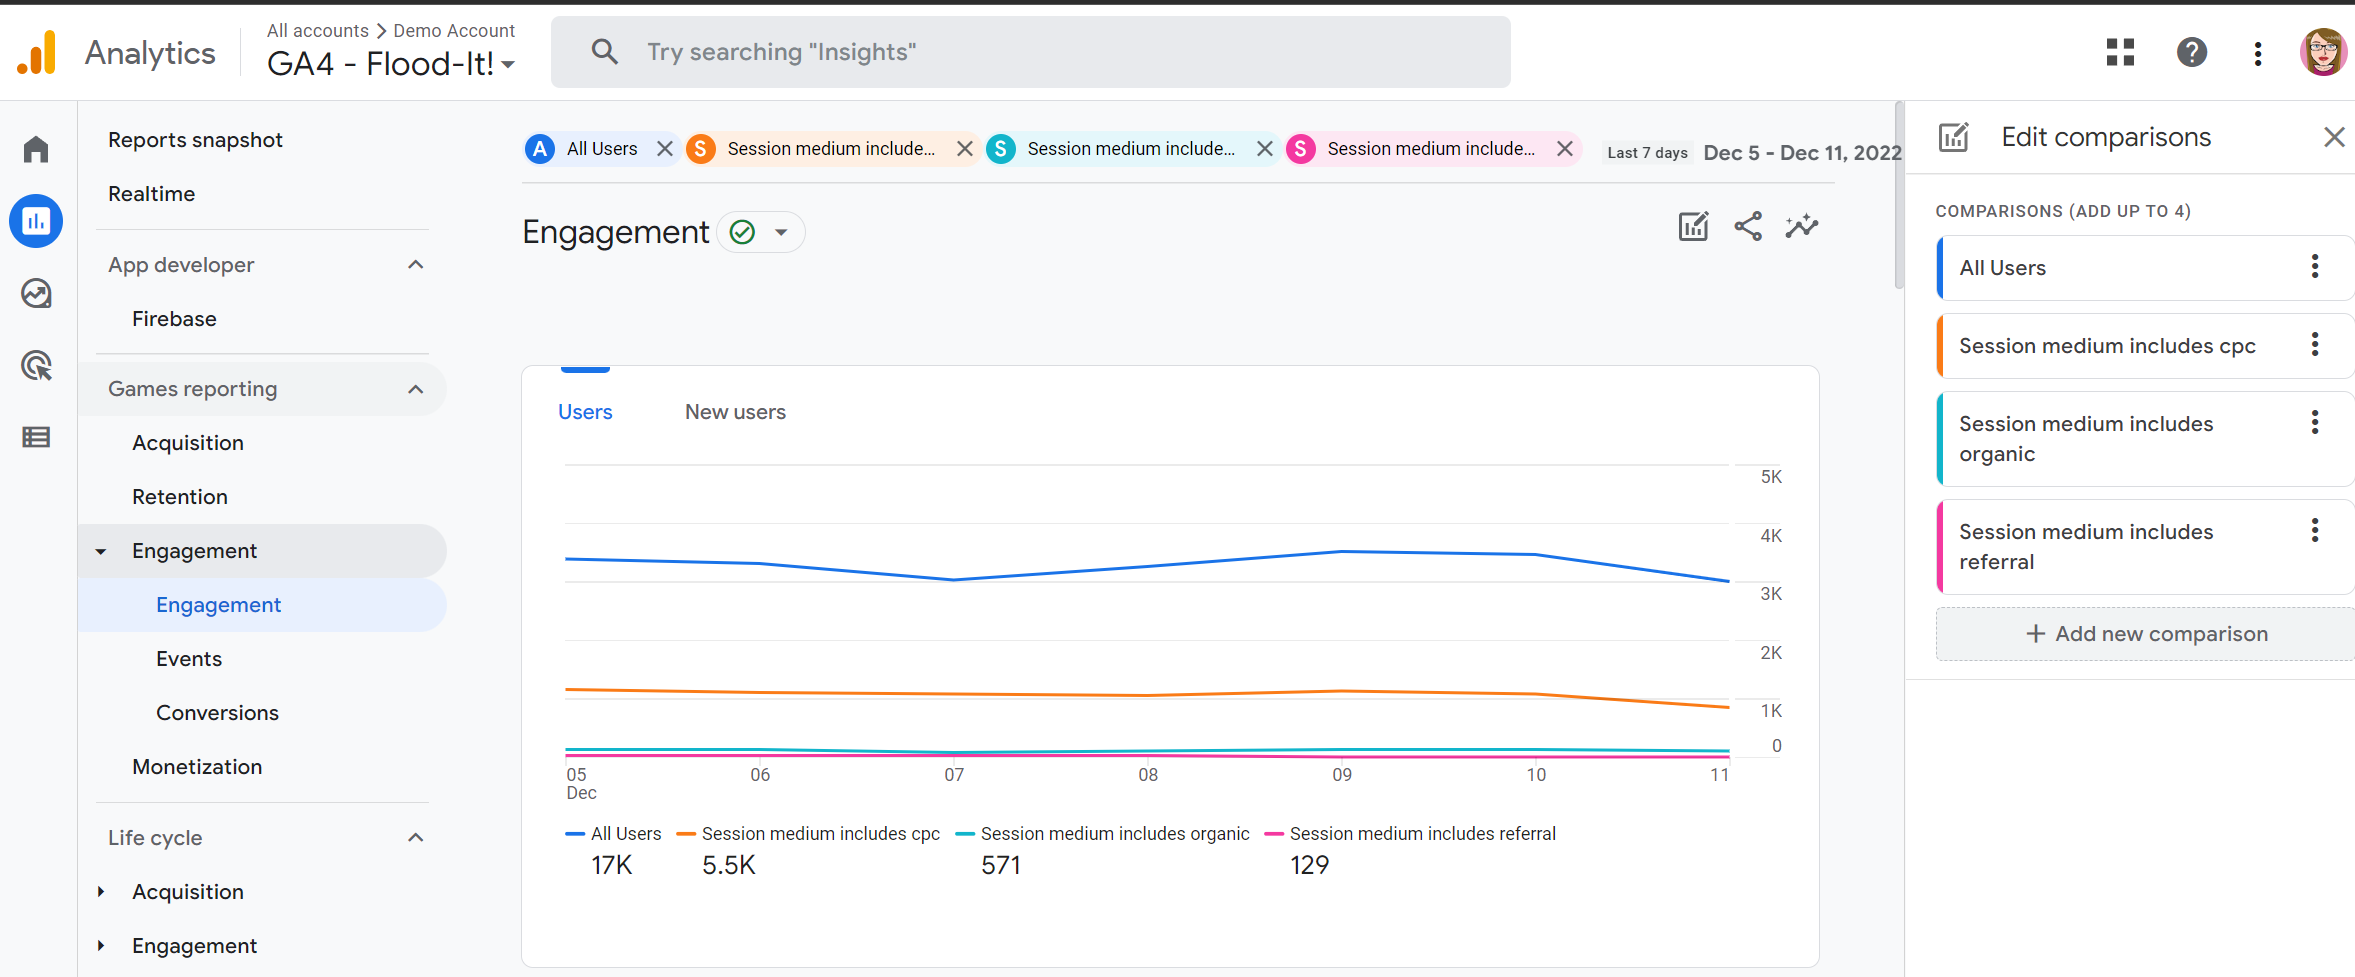
GA4 makes it very easy to add filters and comparisons to your reporting; with so many possible configurations, it's easy to get distracted! The more I use GA4, the more I like it. And if you have set up custom events, you can use the filters to understand both how many people are performing a specific action and how much revenue is associated with that action.
Many predefined reports can be customized, such as conversions, conversion paths, demographic details, order coupons, tech, retention and more. More information can be found at: https://support.google.com/analytics/topic/9303476
What About Bounce Rate?
The bounce rate metric is prevalent in UA reporting, but you may have noticed it is missing from your GA4 reports. What is the bounce rate? Well, traditionally, it's the percentage of sessions that contain a single page view on a website.
However, in GA4, bounce rate is the percentage of sessions that were not engaged. What does that mean? Well, an engaged session is a session of at least 10 seconds, a session that converted, or a session that viewed two or more pages; so any session that doesn't meet the engaged criteria will be considered not engaged.
So should we still be looking at the bounce rate? Bounce rate is a negative metric, the opposite of engagement rate. It could be helpful to shift the mindset to what's working instead of what's not. However, if you're still a fan of UA and want to include this metric, it's easy to add and using a combination of both metrics could be useful.
Adding Bounce Rate to your GA4 Reports
Navigate to Reports / Engagement, Pages & Screens.
Click on the edit Icon in the top right-hand corner to customize the report.
Click on Metrics; this will show you which metrics are currently included in the report.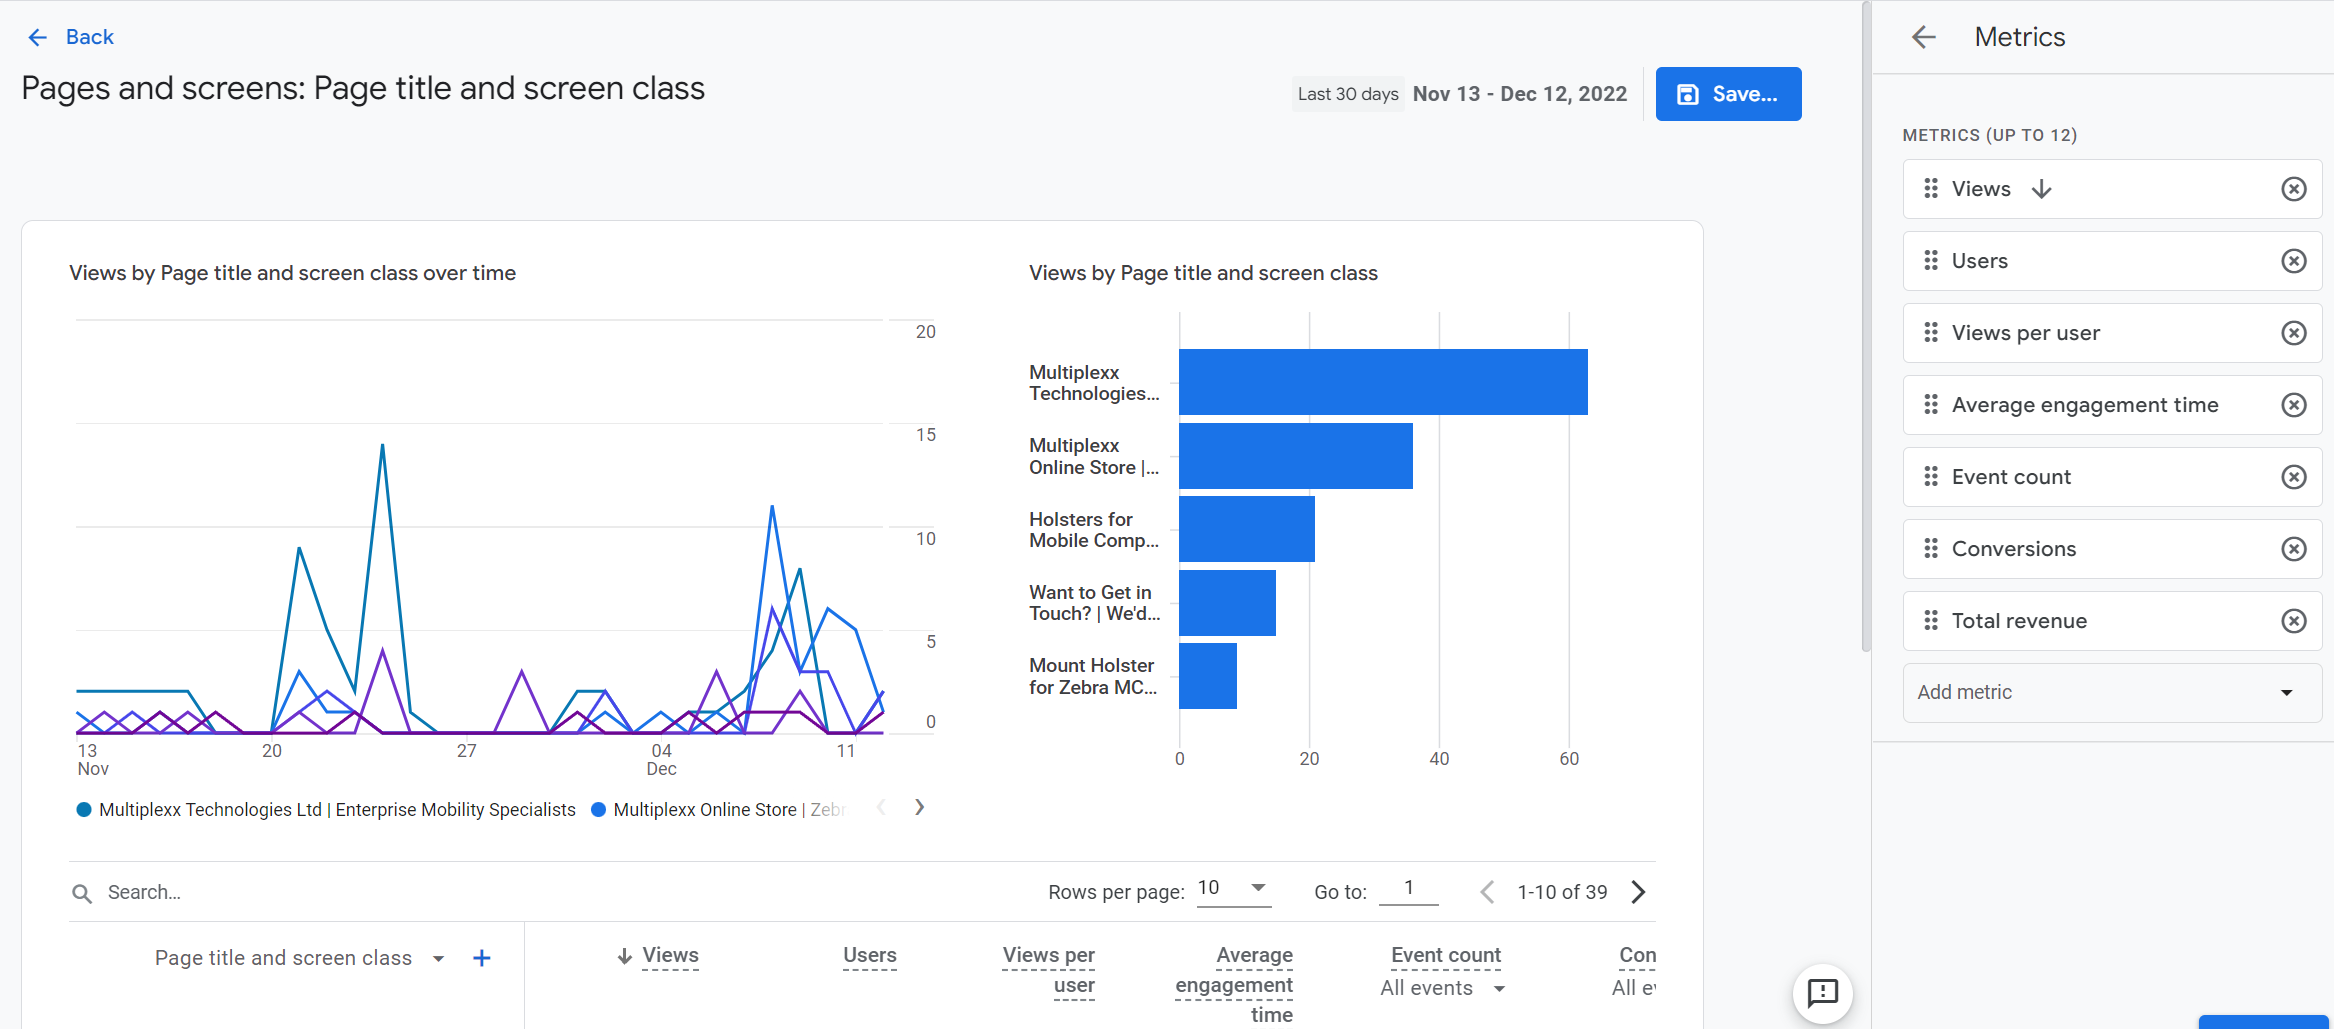
Click on Add metric and select 'bounce rate'; you can move this metric next to views by dragging upwards. Next, click apply; you will now see 'Bounce rate' included in the second column; click Save.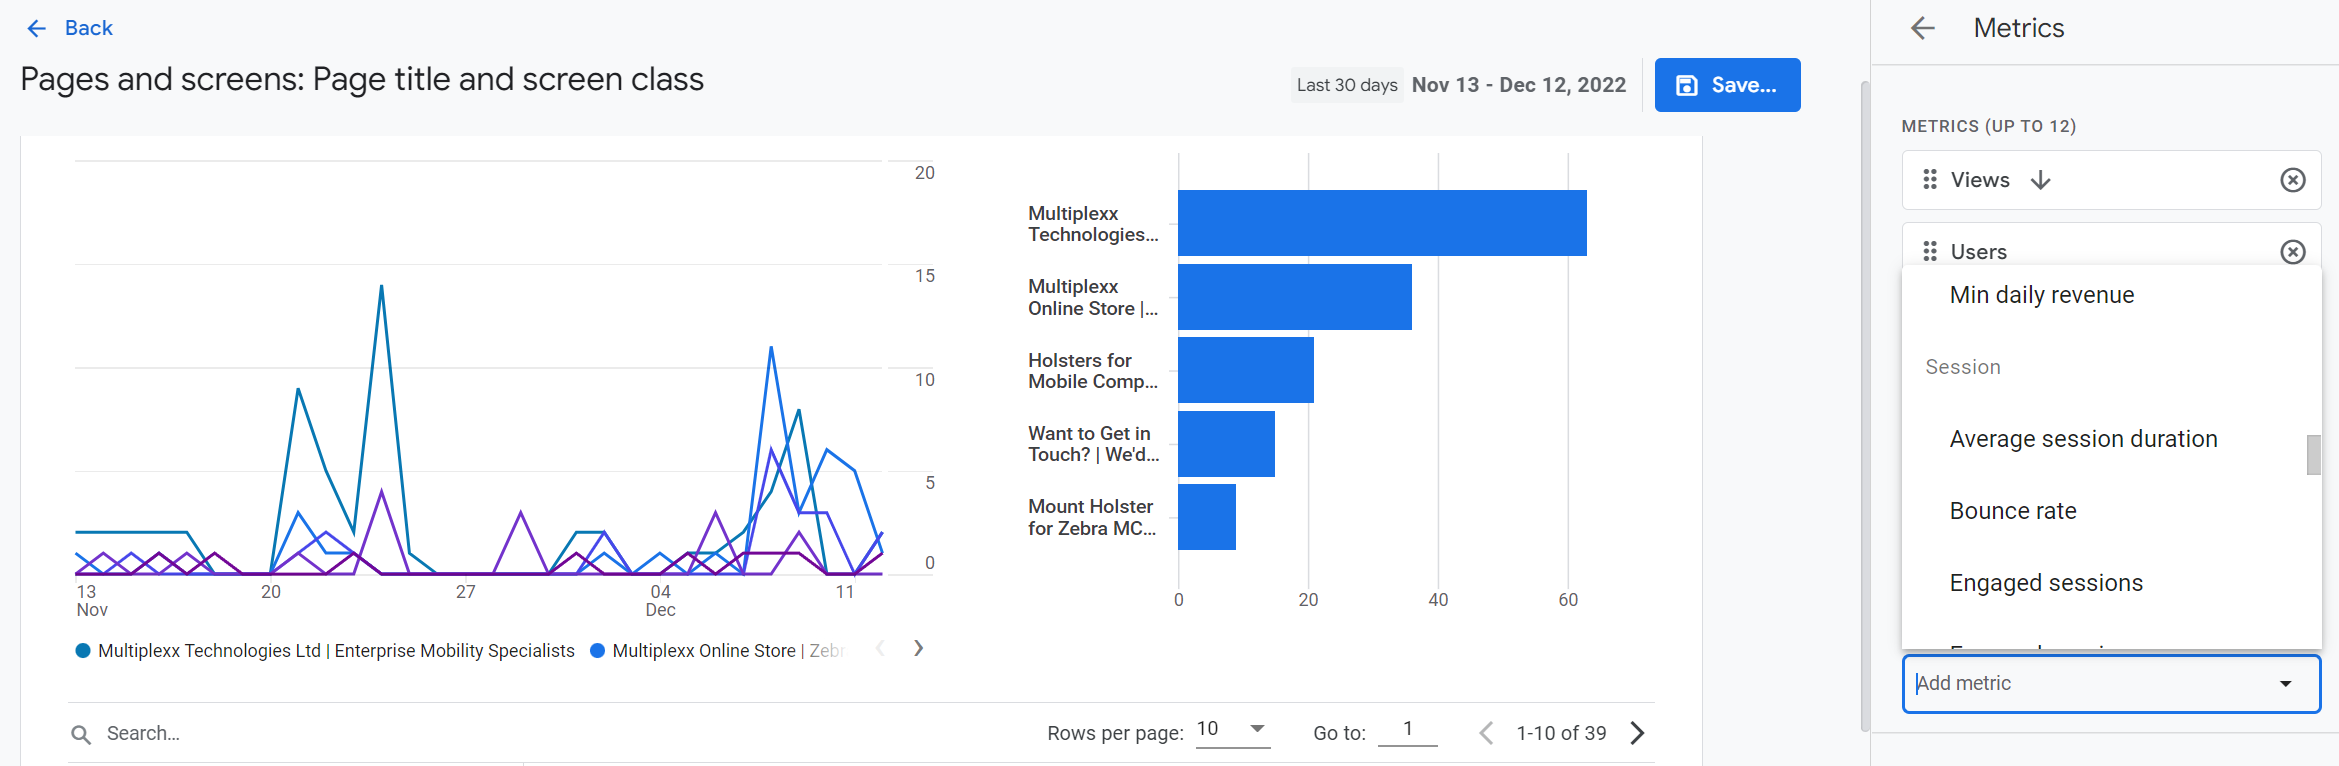
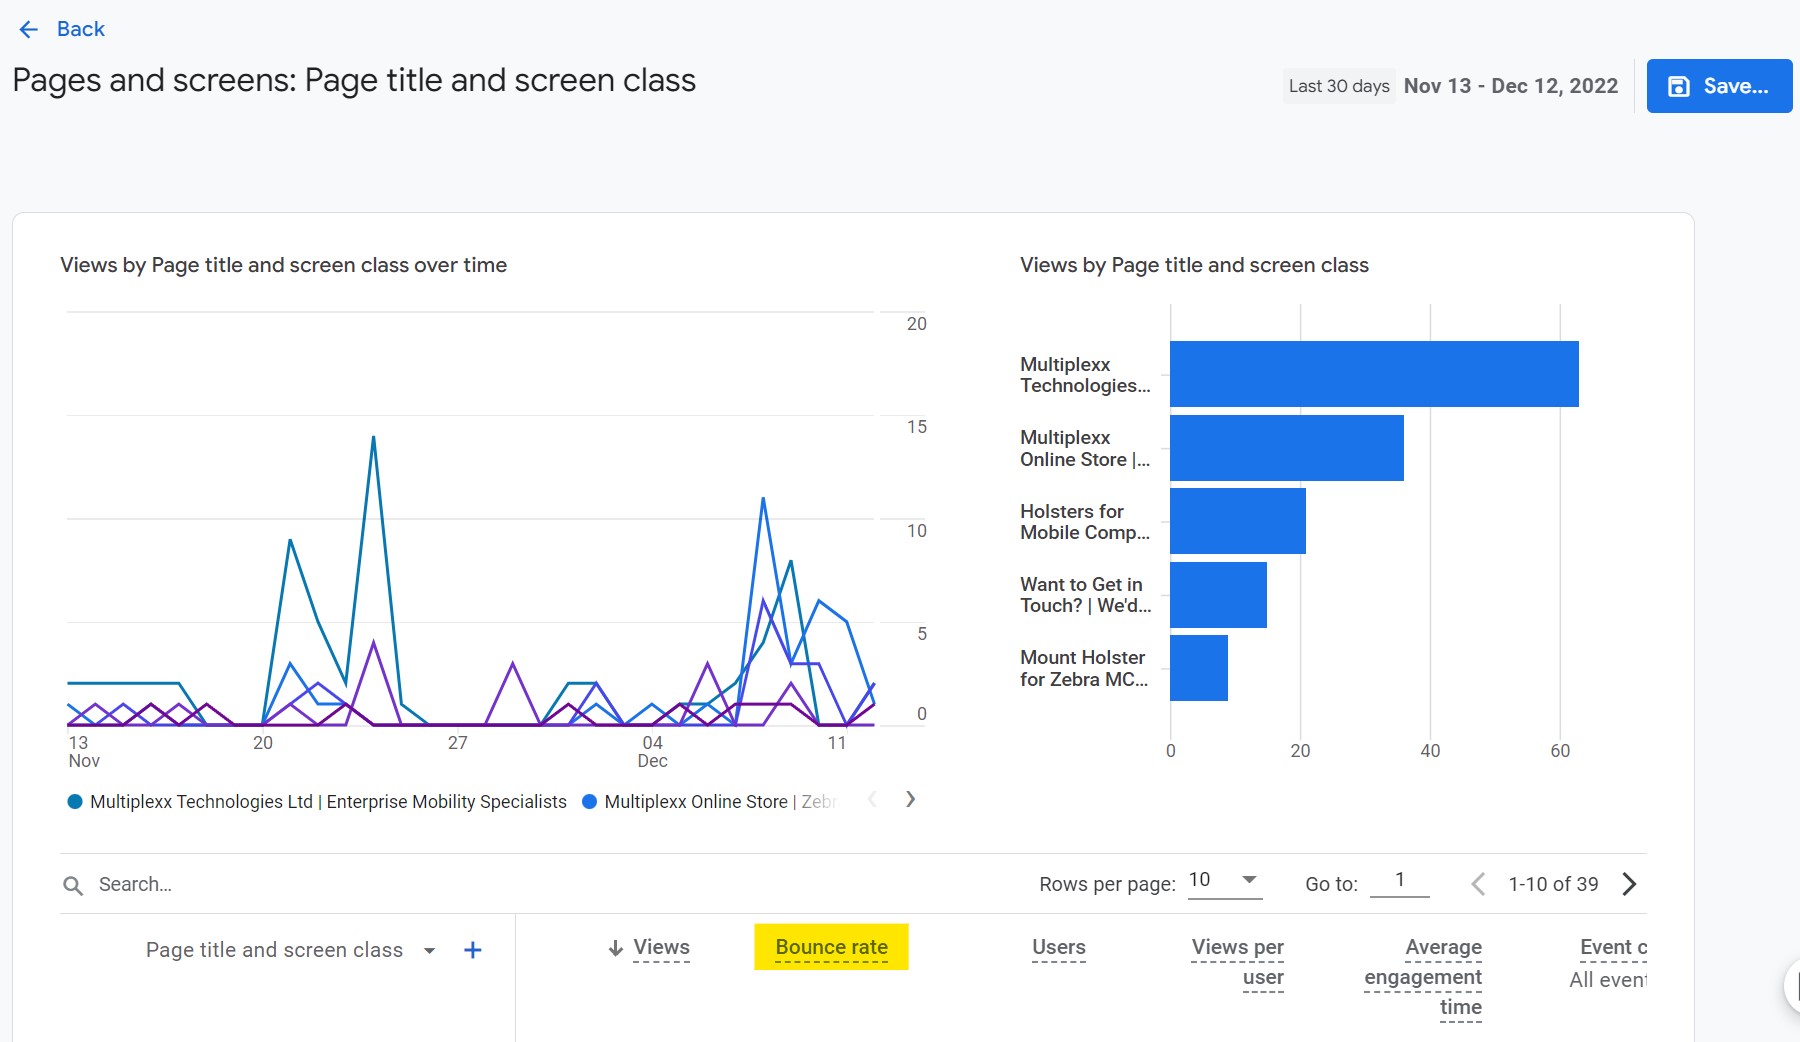
And that's it, 'Bounce Rate' is now included in your report.
Next time we'll look at how to visualize report data using Google Looker Studio, formerly Google Data Studio.

Comments